Blog
Defending the Electoral College since 2009

Recently at Townhall.com, I lampooned as “foolish, insulting, and incorrect” the claim that Republicans should support the National Popular Vote interstate compact (NPV) for political reasons. Strong circumstantial evidence against NPV is the fact that it was created by left-leaning law professors and is directed and funded almost entirely by activists and donors on the left. Are we really to believe that the Soros family, for example, is trying to help Republicans win elections? Yet NPV has, in fact, hired a few former Republican officials to argue that NPV would help Republicans. Such claims deserve to be defeated on the merits.
In this post, we will consider a few charts produce by NPV lobbyists. Their argument goes like this: Democrats have a “blue wall” of states they always win in presidential elections; this gives them an edge in the Electoral College; if just a few more states turn blue, Republicans can never win again.
Making such predictions is a fraught exercise. In statistical terms, there aren’t enough elections (not enough data) and conditions constantly change (too many variables). More simply: politics never moves in a straight line. While we know what has happened in the past, nobody knows for sure what will happen a few years—or a few elections—in the future. Yet even on its own terms, NPV’s argument is unraveling.
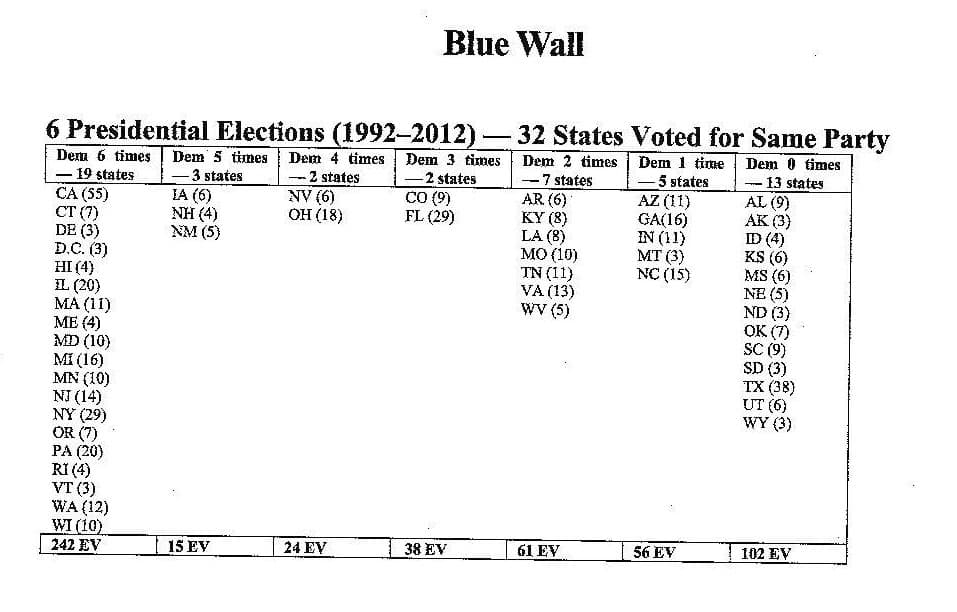
NPV lobbyists began using a chart after 2012 that showed the “wall”—19 states with 242 electoral votes that had voted Democrat in the last 6 presidential elections. Over the same time span, there were just 13 states worth 102 electoral votes that had consistently voted Republican. The dire prediction at that time was that the Electoral College was about to lock Republicans out of the White House—yet the very opposite happened in 2016. But before we examine 2016 and 2020, let’s consider why NPV lobbyists start their chart in 1992.
What is special about the 1992 election is that Democrats finally won. They had lost the three previous elections in two blowouts (1980 and 1988) and one near shutout (1984). In the three elections before that, each party triumphed in one close election (Democrats in 1976, Republicans in 1968) and Republicans won another near shutout (1972).
What if someone made the same chart as NPV, but from 1968 to 1988? In those six presidential elections, there were 21 states that voted Republican every single time—an even bigger “red wall.” But what if NPV’s chart went back just one more election, including 1988 through 2012? The “blue wall” disappears, with just nine states worth 90 electoral votes going consistently for the Democrats. In other words, NPV lobbyists have created a mirage by carefully selecting what is otherwise an arbitrary starting point.
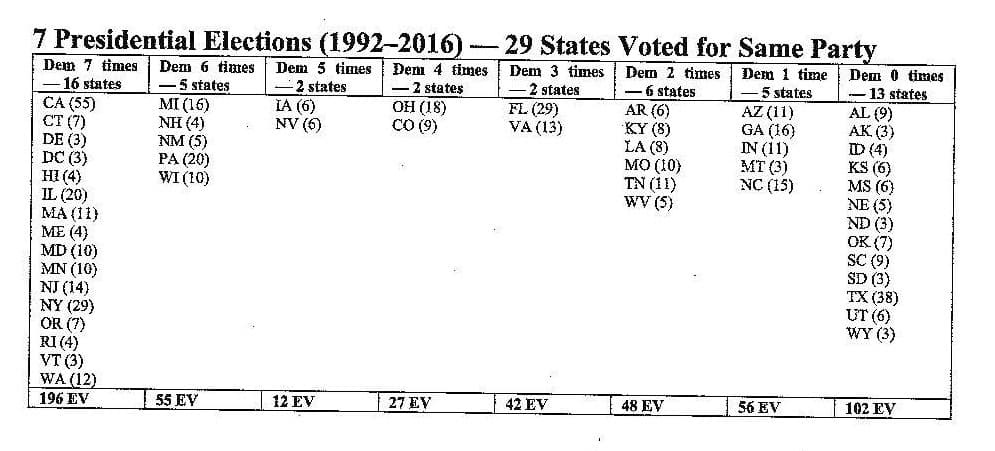
It also gets worse for NPV going forward. Add in the 2016 election and the wall loses three states and 46 electoral votes. Meanwhile, Republicans lose zero of their consistent states. NPV’s own chart shows their argument getting weaker.
Finally, NPV has a chart that goes from 2000 to 2020. It shows 16 states consistently voting Democrat, worth 195 electoral votes, and 20 states sticking with Republicans, worth 152 electoral votes. That isn’t a huge difference—certainly not an insurmountable wall—and reapportionment has since shifted two of those electoral votes from the Democrat column to the Republican one. All this is from a series of elections that, while split between the parties, featured Republicans winning two historic squeakers only because their geographically broader coalition carried the Electoral College.
Perhaps a better statistic to examine is which party in 2020 won more states with the narrowest margins. There were eight states won by less than 5%, with Democrat winning six, Republicans two. Another six states were won by a margin between 5% and 10%, with the parties splitting those states. Together, those fourteen states are worth 204 electoral votes—plenty of battleground for either political party to win future elections.
In the 1980s, many pundits and scholars insisted that Republicans had a lock on the White House while Democrats were guaranteed to keep control of the House of Representatives. Then the Democrats won the 1992 presidential election and Republicans took control of Congress in 1994. None of this was unique in American politics, which has featured such predictions—and their ignominious upsetting—time and again. NPV lobbyists are free to make their dire predictions, and the rest of us are wise to take them with a hefty pinch of salt.
Time is running out
There is a real, immediate threat to the constitutional way we elect our president. National Popular Vote is 77% of the way to implementing their dangerous plan.